Have you ever had a bug in your code? If it’s not the case you are a rare gem ahahah
In reality, it’s quite common. Every developer encounters bugs that need deeper debugging. So, you start debugging with console.log
then you realize it’s gonna be a long process because you would always need additional information that you haven’t printed yet.
So, you have to redo the step to reproduce again and again, making you lose time and patience.
At this point, you should attach a debugger to be able to execute the code step by step and see all the information at each step of the execution.
It’s easy to attach to the main process, but what about Child process API, or Worker threads?
Prerequisites
To be able to debug a node process you need:
- node installed on your computer when debugging locally
- a debugging tool:
- chrome DevTool or edge DevTool
- VS Code DevTool
- JetBrains IDE DevTool
- …
Attach your first debugger DevTool
Enable the Node.js inspector
To debug a node process, you have to run your script with one of these flags:
--inspect: starts the application and allows you to attach a debugger at any time--inspect-brk: starts the application but pauses the execution at the first line of your script
By default, the Node.js runs on host 127.0.0.1 (localhost) and port 9229. However, when debugging multiple processes (such as Child Processes or Worker Threads),
it is often useful to specify a different port for each process to avoid conflicts.
You can define a different host and port as parameter to the flag:
--inspect=[host:port]--inspect-brk=[host:port]
Problem of unavailable port
If you encounter the error:
Starting inspector on 127.0.0.1:9229 failed: address already in use.
It means that the port 9229 is not available. Therefore, you have to define another port.
You have to either:
- choose a different port
--inspect-brk=4545 - let NodeJS choose a random free port
--inspect-brk=0(you can find the port in your terminal) - kill the current process
lsof -i :9229and thenkill -9 processId
Even if you run the inspector on a random port, you can always find the host and port in the logs:
- Host: The host where the inspector is running on.
- Port: The port where the inspector is running on.
Attach the debugger to the inspector
Now that your script is running with inspect mode enabled, it’s time to attach the DevTool to the inspector.
I am going to explain to you how to do it with the chrome DevTool because it does not rely on any single IDE/editor.
When the inspector is listening on the default port 9229
The fastest way is to open the chrome devtool:
- Ctrl Maj J on Windows and Linux
- Cmd Option J on macOS
![]()
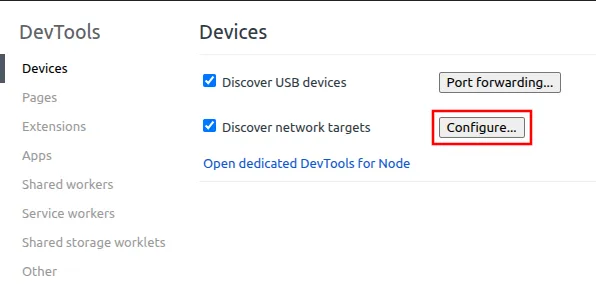
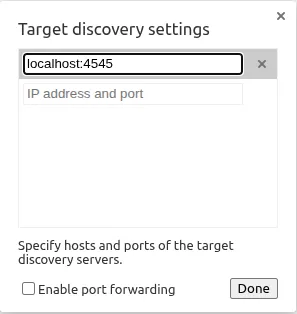
For every case
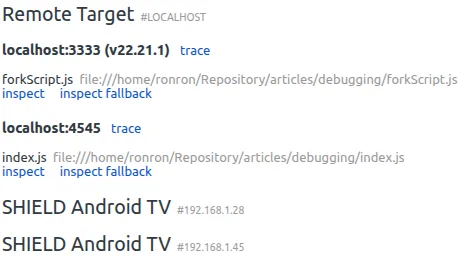
To be able to connect on any process you just have to go on chrome://inspect. Then you will be able to configure a host and port to listen to.
For example, if you want to listen to localhost:4545 you just have to add it by clicking on the Configure button:
And now, as soon as you start your process with inspect mode you will see it in the interface:
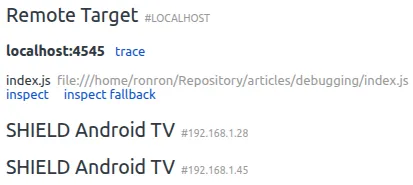
Then, click on the inspect button and just debug :)
Attach a debugger to a child process and worker thread
When dealing with Child Process and Worker Thread, you will never enter into the code when having only an inspector on the main process.
const { fork } = require('node:child_process');

const child = fork('forkScript.js', []);
You need to “tell” that new process that you want to attach an inspector too. You can do it thanks to the execArgv property:
const { fork } = require('node:child_process');

const child = fork('forkScript.js', [], {
  execArgv: ['--inspect-brk=3333'],
});
Then, you just have to configure the connection and you will see it in the interface too, ready to be debugged:
Debug a CLI
Command Line Interface like astro dev is often installed as npm packages and exposed in node_modules/.bin.
To debug them, you need to run them explicitly with Node.js and enable the inspector.
node --inspect-brk node_modules/.bin/astro dev
Debugging a Remote Process
If you need to debug a Node.js process running on a remote server (e.g., a VPS), you might consider exposing
the debugger port directly. For example, you could open a specific port like 34.234.564.45:9229 and configure your debugger to connect to it.
However, exposing a debugger port directly is highly insecure. Anyone with access to the port could attach their debugger, potentially exposing sensitive environment variables or even executing arbitrary code in your environment.
Secure Approach: Use an SSH TunnelInstead of exposing the debugger port, create an SSH tunnel to securely forward the remote port to your local machine. This ensures that the connection is encrypted and only accessible to you.
ssh -L local_port: remote_address: remote_port username@server.com

# For example
ssh -L 9229:localhost:9229 username@34.234.564.45
With this setup, you can now attach your debugger to localhost:9229 on your local machine, as if the process was running locally.
Conclusion
Say goodbye to endless console.log debugging, along with the frustration and wasted time that come with it.
Now you have the tools to debug efficiently with Node.js Inspector:
- —inspect and —inspect-brk are your new go-to commands to start a debugging session in seconds.
- Remember that for child processes and worker threads, configure
execArgvto enable the inspector on each one. chrome://inspectis your gateway, this is where you connect Chrome DevTools and start stepping through your code like a pro.
I hope you enjoy your future debugging sessions.
Thanks for reading
You can find me on Twitter if you want to comment this post or just contact me. Feel free to buy me a coffee if you like the content and encourage me.